


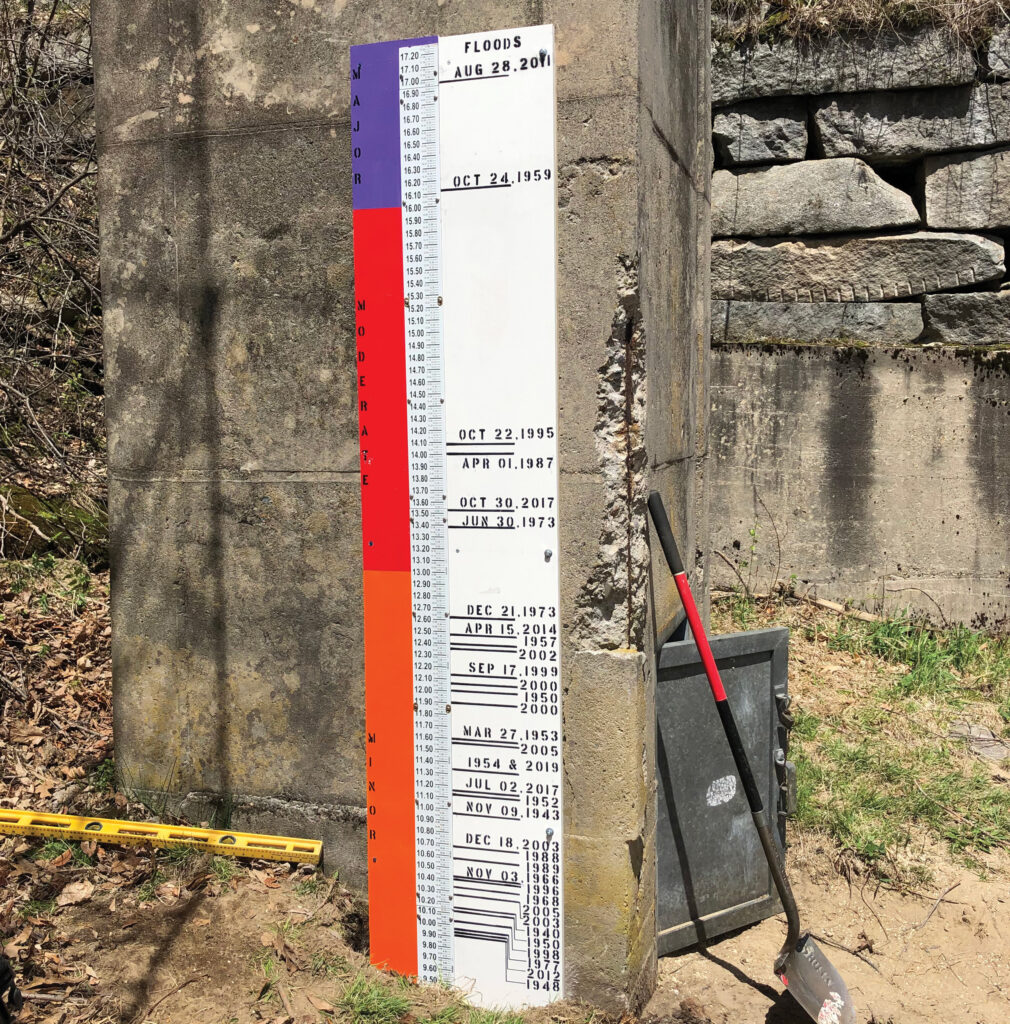
United States Geological Survey gauge 01075000 on the Pemigewasset River at Woodstock, New Hampshire. This high water–mark monument was installed in May 2021 and shows that the peak for the period of record at this gauge was from Tropical Storm Irene in 2011. This gauge has reported peaks for 77 years. Photographed by Richard Kiah.
Heading to the river? Bring the right gear. Scope out the weather. And check the local river gauges—because the river decides if your boat moves, if the fish bite, and if you get home safely.
If you’re not sure how to do that, you’re not alone. Whitewater paddlers and fly fishermen talk about reading river gauges, but it can be confusing if you don’t know what the numbers are really telling you.
At the most basic level, rivers are measured in two ways: how high the water is and the volume of water moving downstream. In the past, people only measured river height, or stage. “People would paint lines on a bridge piling,” says Dave Jackson, a whitewater kayaker from Wheeling—and my brother. “That’s called a stick or foot gauge. Every one of those is going to be local and arbitrary. It’s simply telling you how high the water is at that moment, not how much water is actually moving.”
Many foot gauges are generations old. Stage numbers are unique—a reading of three feet on one stream might mean perfect conditions, while three feet on another could mean dangerously high water. Unless you know that stretch of river, the number alone doesn’t tell you much.
The other problem is that rivers don’t rise evenly. Most channels are shaped like a bowl, so when water gets higher, it spreads wider and deepens quickly. The difference between two and three feet might be minor, but the jump from seven to eight feet could be a huge increase in volume.
Modern river gauging is more reliable. The United States Geological Survey (USGS) monitors many streams and collects data on river height as well as volume, measured in cubic feet per second (CFS). “One cubic foot is roughly the size of a beach ball,” Jackson says. “So, if a river is flowing at 2,000 CFS, imagine 2,000 beach balls of water rushing downstream every second.”
CFS is useful because it’s standardized: 1,000 CFS always means the same amount of water. However, it’s important to remember that CFS numbers tell you how much water is moving, but not how that water will behave in a specific place. A gentle flow on the Cheat River might be a flood on its tributary, Big Sandy Creek.
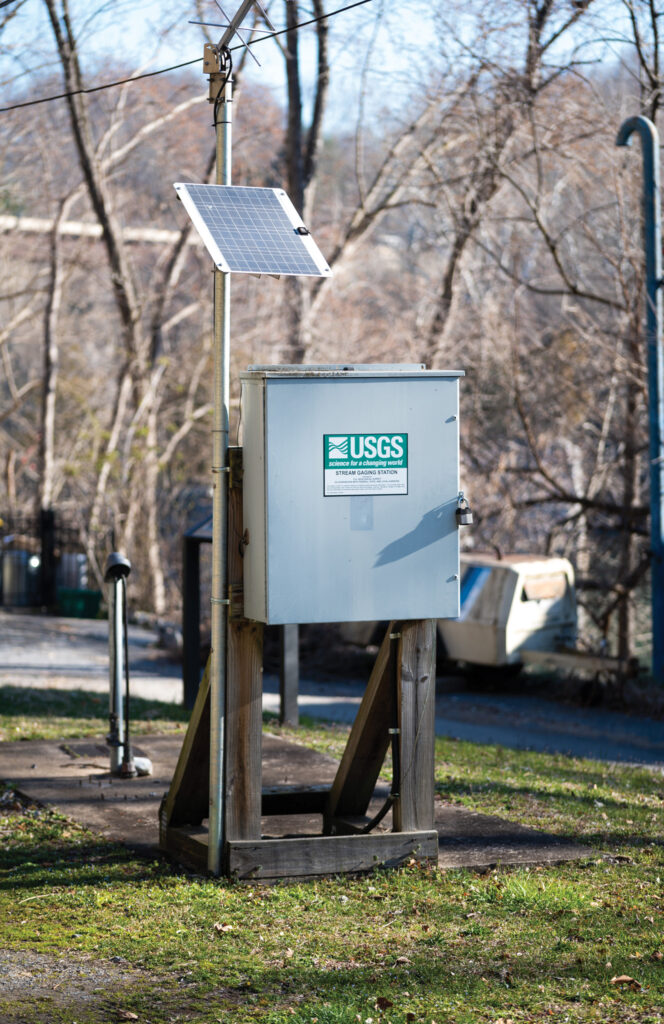
USGS gauge 01618000 on the Potomac River at Shepherdstown, West Virginia. Photographed by David Fisher.
“Context is everything,” Jackson says.
If this still feels like a lot of information—because it is—resources like the USGS’s water data website as well as American Whitewater’s website take a lot of the guesswork out of a day on the river. Both offer graphs and flow ranges that can help you decide whether water levels are low, ideal, or potentially dangerous.
Trends are especially important. Look at the graph. Are levels rising? Quickly? Think about the weather. Did it just rain? Is snow melting? Is the water swirling and muddy? This may not be your day. On the other hand, if levels are falling slowly, the fish may be biting. Pay attention. Use common sense and trust your gut—a rising four feet is quite different from a stable or falling four feet.
Still, the old ways sometimes work well. For smaller streams without gauges, people may rely on experience and visual clues: a certain rock disappearing, water reaching a fence post, or a familiar hydraulic changing character. Talk to locals if you’re unsure about river conditions—they’ll know.
“Technology gives us numbers,” Jackson says, “but experience teaches us what those numbers mean.”